Your electricity bill
See details below about how to understand the structure of your electricity bill
-
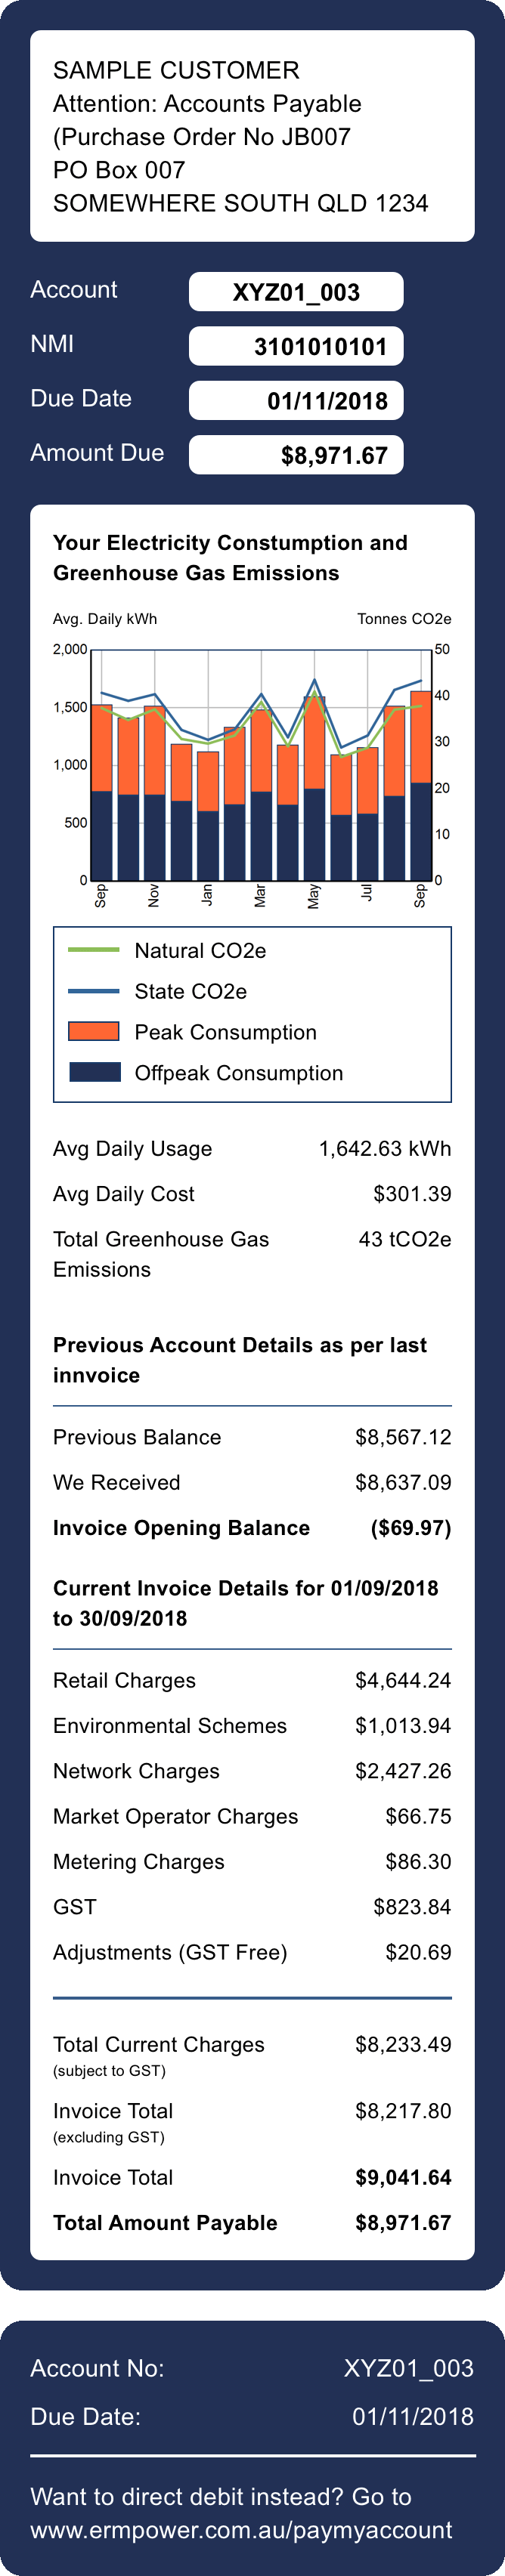
Summary graph
The lines of the graph show the CO2 emissions in tonnes and the bars show the average daily energy use for the month in kilowatt hours. -
Summary info
Average daily usage, daily cost and CO2 emission relating to the period of the invoice.
National CO2e refers to the average CO2 emissions across all states. The State CO2e refers to the CO2 emissions of the State of the site this bill refers to.
-
Energy usage
This reflects your energy usage characteristics for the time periods specified in your contract. The energy usage is net of any generation back into the grid. -
Retail charges
This reflects your energy usage and charges for the time periods specified in your contract. The energy usage is net of any generation back into the grid. Energy productivity measures that reduce consumption of grid supplied energy may have a positive affect this component of your bill. -
Energy charges loss factor
The Loss Factor (net of distribution and transmission losses) is applied to the metered usage to get the Total Price (excl GST). Energy productivity measures on your site will not influence the loss factor. -
Environmental charges
Charges relate to the various legislated State and Federal government green schemes. These charges are generally linked to energy usage. Therefore, energy productivity measures that reduce consumption of grid supplied energy may have a positive affect this component of your bill. -
Environmental charges loss factor
The Loss Factor that is applied to metered usage to get the Total Price (excl GST) can be the Net Loss Factor, the Distribution Loss Factor or nil depending on the environmental scheme. Energy productivity measures on your site will not directly influence the loss factor. -
Network charges
Network tariffs are charges energy retailers pass through via your bill on behalf of the local network provider in the area the site is located. The network provider determines your tariff based on the site's electricity usage and consumption patterns. Energy productivity measures that reduce overall consumption of grid supplied energy, reduce maximum daily load and/or improve the power factor may have a positive affect this component of your bill. -
Market operator charges
These charges are passed through to you and represent your portion of the fees payable by your energy retailer to the Australian Energy Market Operator, the manager of the National Electricity Market (NEM). These charges are generally linked to energy usage. Therefore, energy productivity measures that reduce consumption of grid supplied energy may have a positive affect this component of your bill. -
Metering charges
Metering and other refers to metering charges payable under your agreement, either for metering arranged by your energy retailer or directly by you under a direct agreement with a Metering Provider. This is a fixed cost unaffected by energy productivity measures. -
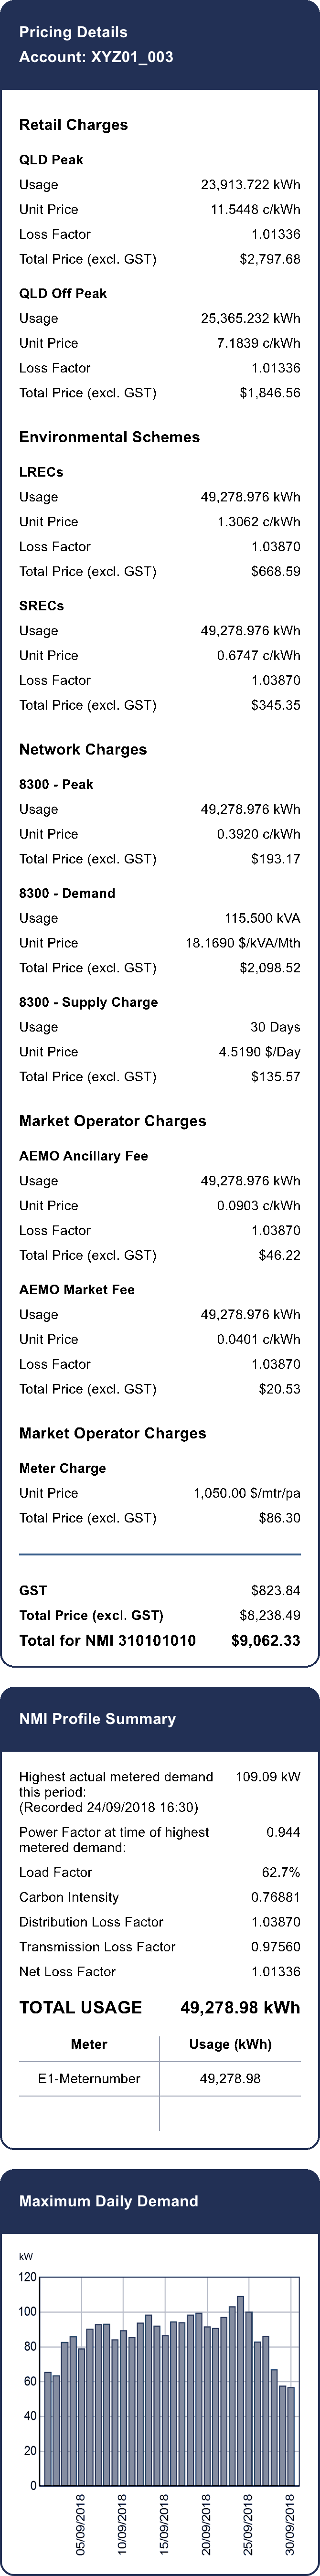
Power factor
This is the ratio of real power (watts) compared to apparent power (volts amperes) flowing to this site. Some Network providers' charges are affected by a less than optimal Power Factor (less than 1). Investment to improve your power factor may have a positive effect on the ‘network charge’ component of your bill -
Load factor
This is the average load divided by the peak load in a specified time period. The lower your load factor indicates the ‘peakier’ is your load. Investment in energy productivity measures aimed at improving your load factor may have a positive effect on the ‘network charge’ component of your bill, specifically targeting the demand charge. -
Carbon intensity index
This is an indexed figure which is based on the physical half hourly generation being dispatched into the National Electricity grid. -
Loss factors
Loss factors relate to energy lost due to electrical resistance and the heating of conductors as electricity flows through the transmission and distribution networks. These factors compensate for that loss. Distribution loss factors represent the distribution network operated by Ergon and Energex, while transmission loss factors represent the transmission network operated by Powerlink. Energy productivity measures on your site will not directly influence the loss factor. -
Demand graph
This shows the highest kW or kVA demand for any ½ hour period during the month. Investment in energy productivity measures aimed at reducing maximum daily demand may have a positive effect on the ‘retail charges’ and ‘network charge’ components of your bill.